Prescription data
This analysis uses the following datasets:
GP Practices in Bradford
Location and median number of registered patients by practice:
Trends
Trends in the number of prescriptions per patient for each practice have been calculated for:
Antidepressant drugs - BNF: 0403
Hypertension and heart failure - BNF: 0205
Corticosteroids (respiratory) - BNF: 0302
Select a type of prescription:
viewof caztype = Inputs.select(indicatortypes, {value: "Antidepressant drugs", label: "Prescription Type"})
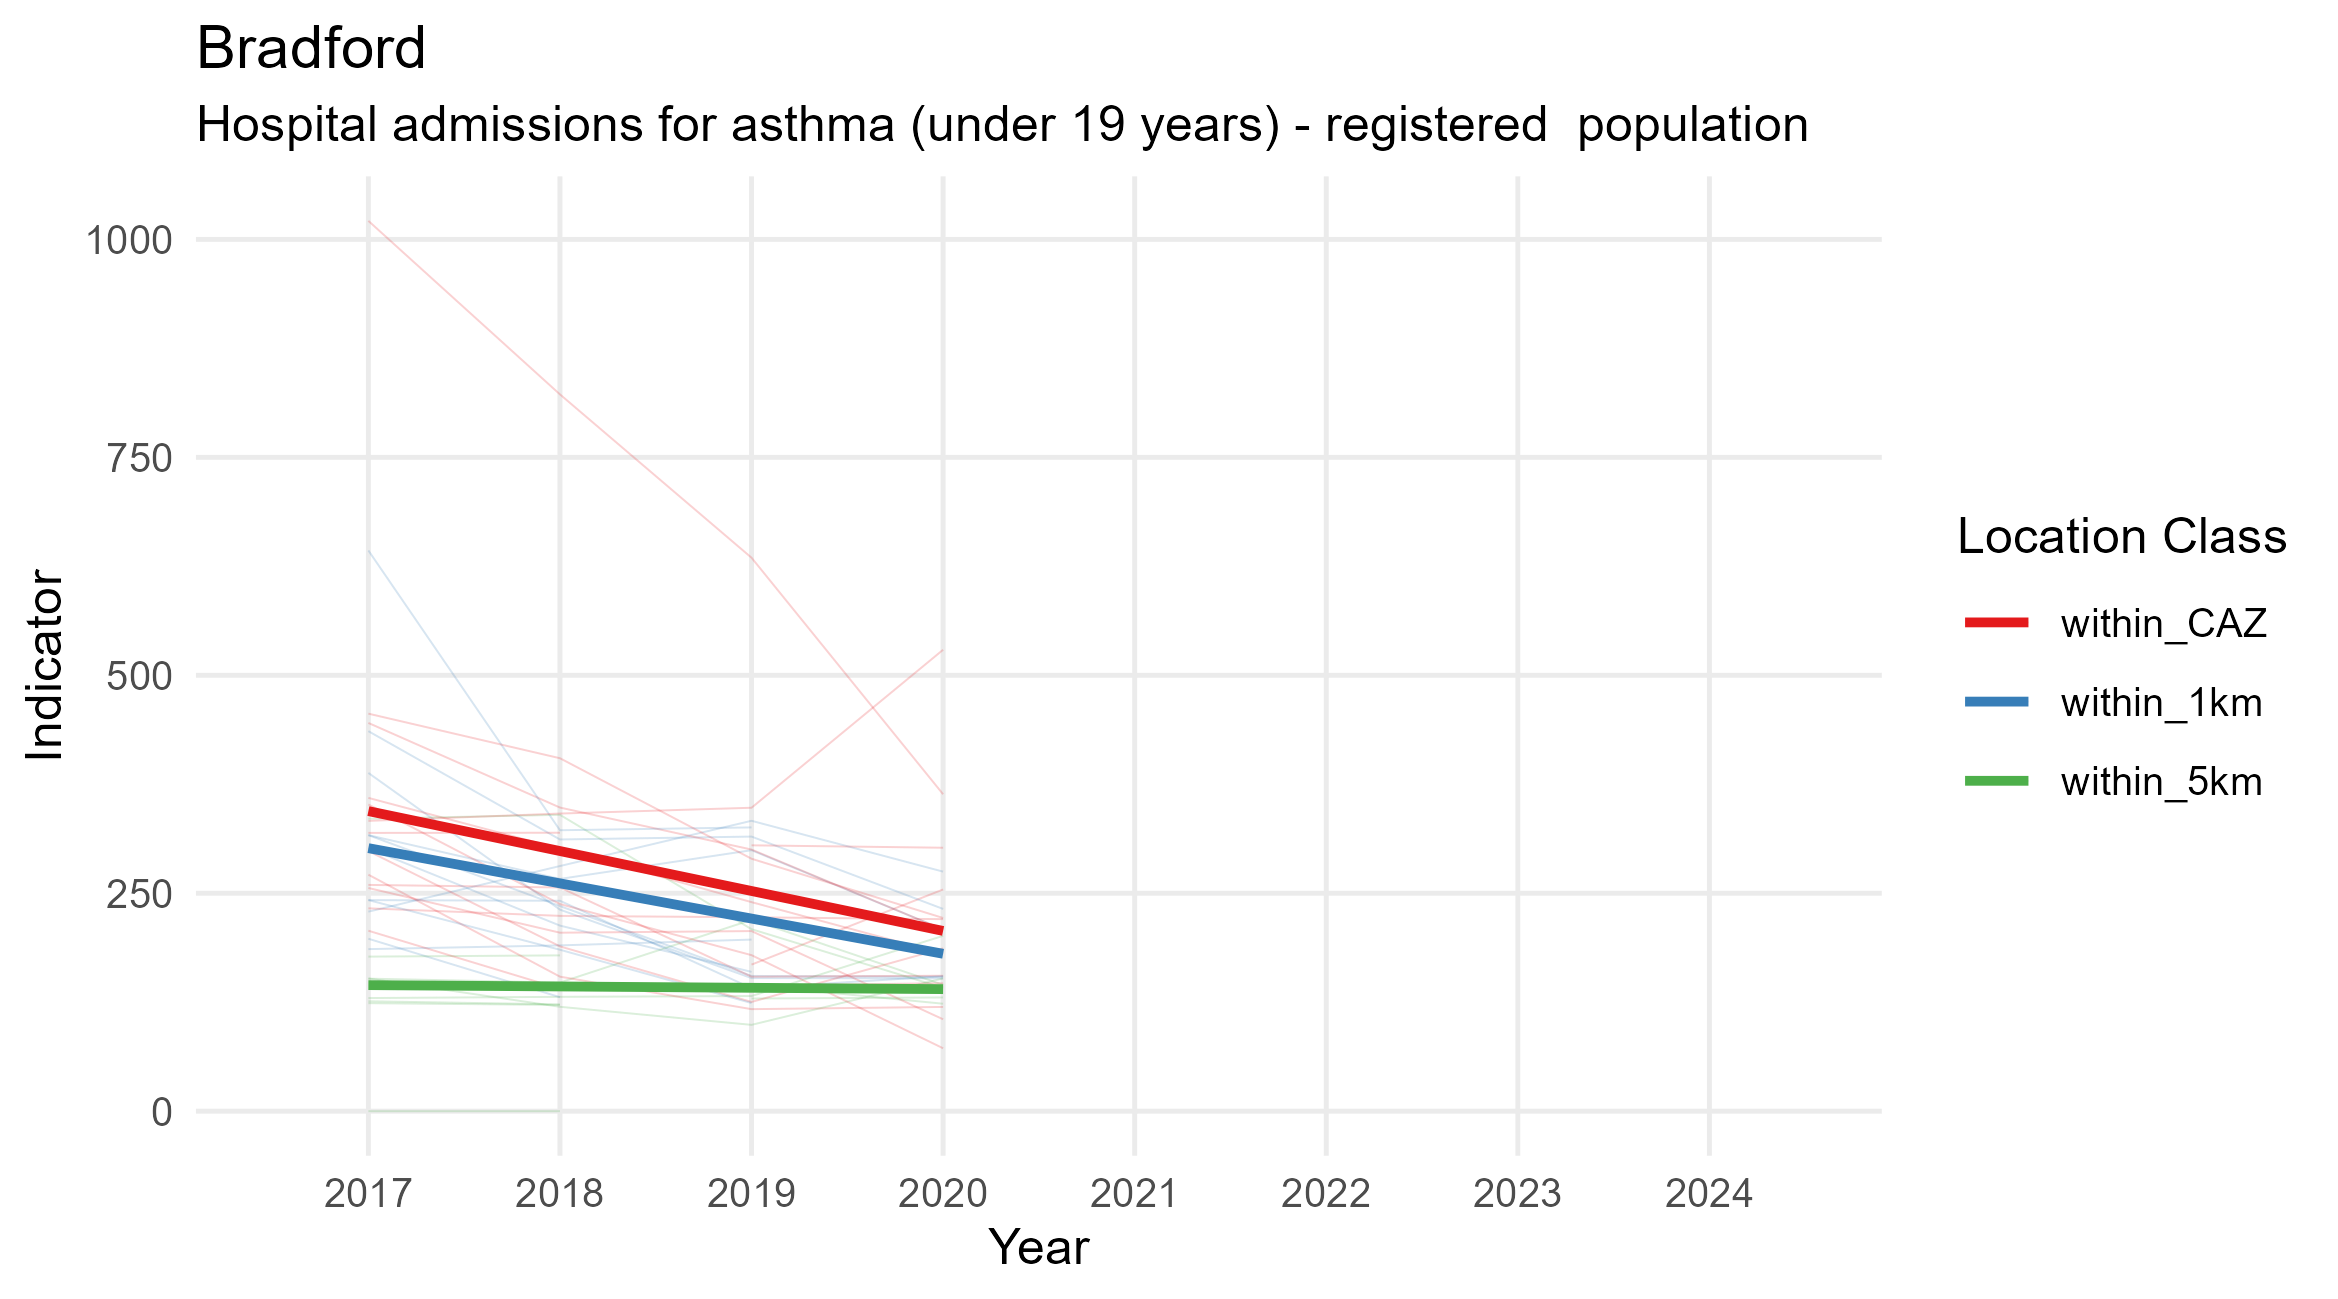
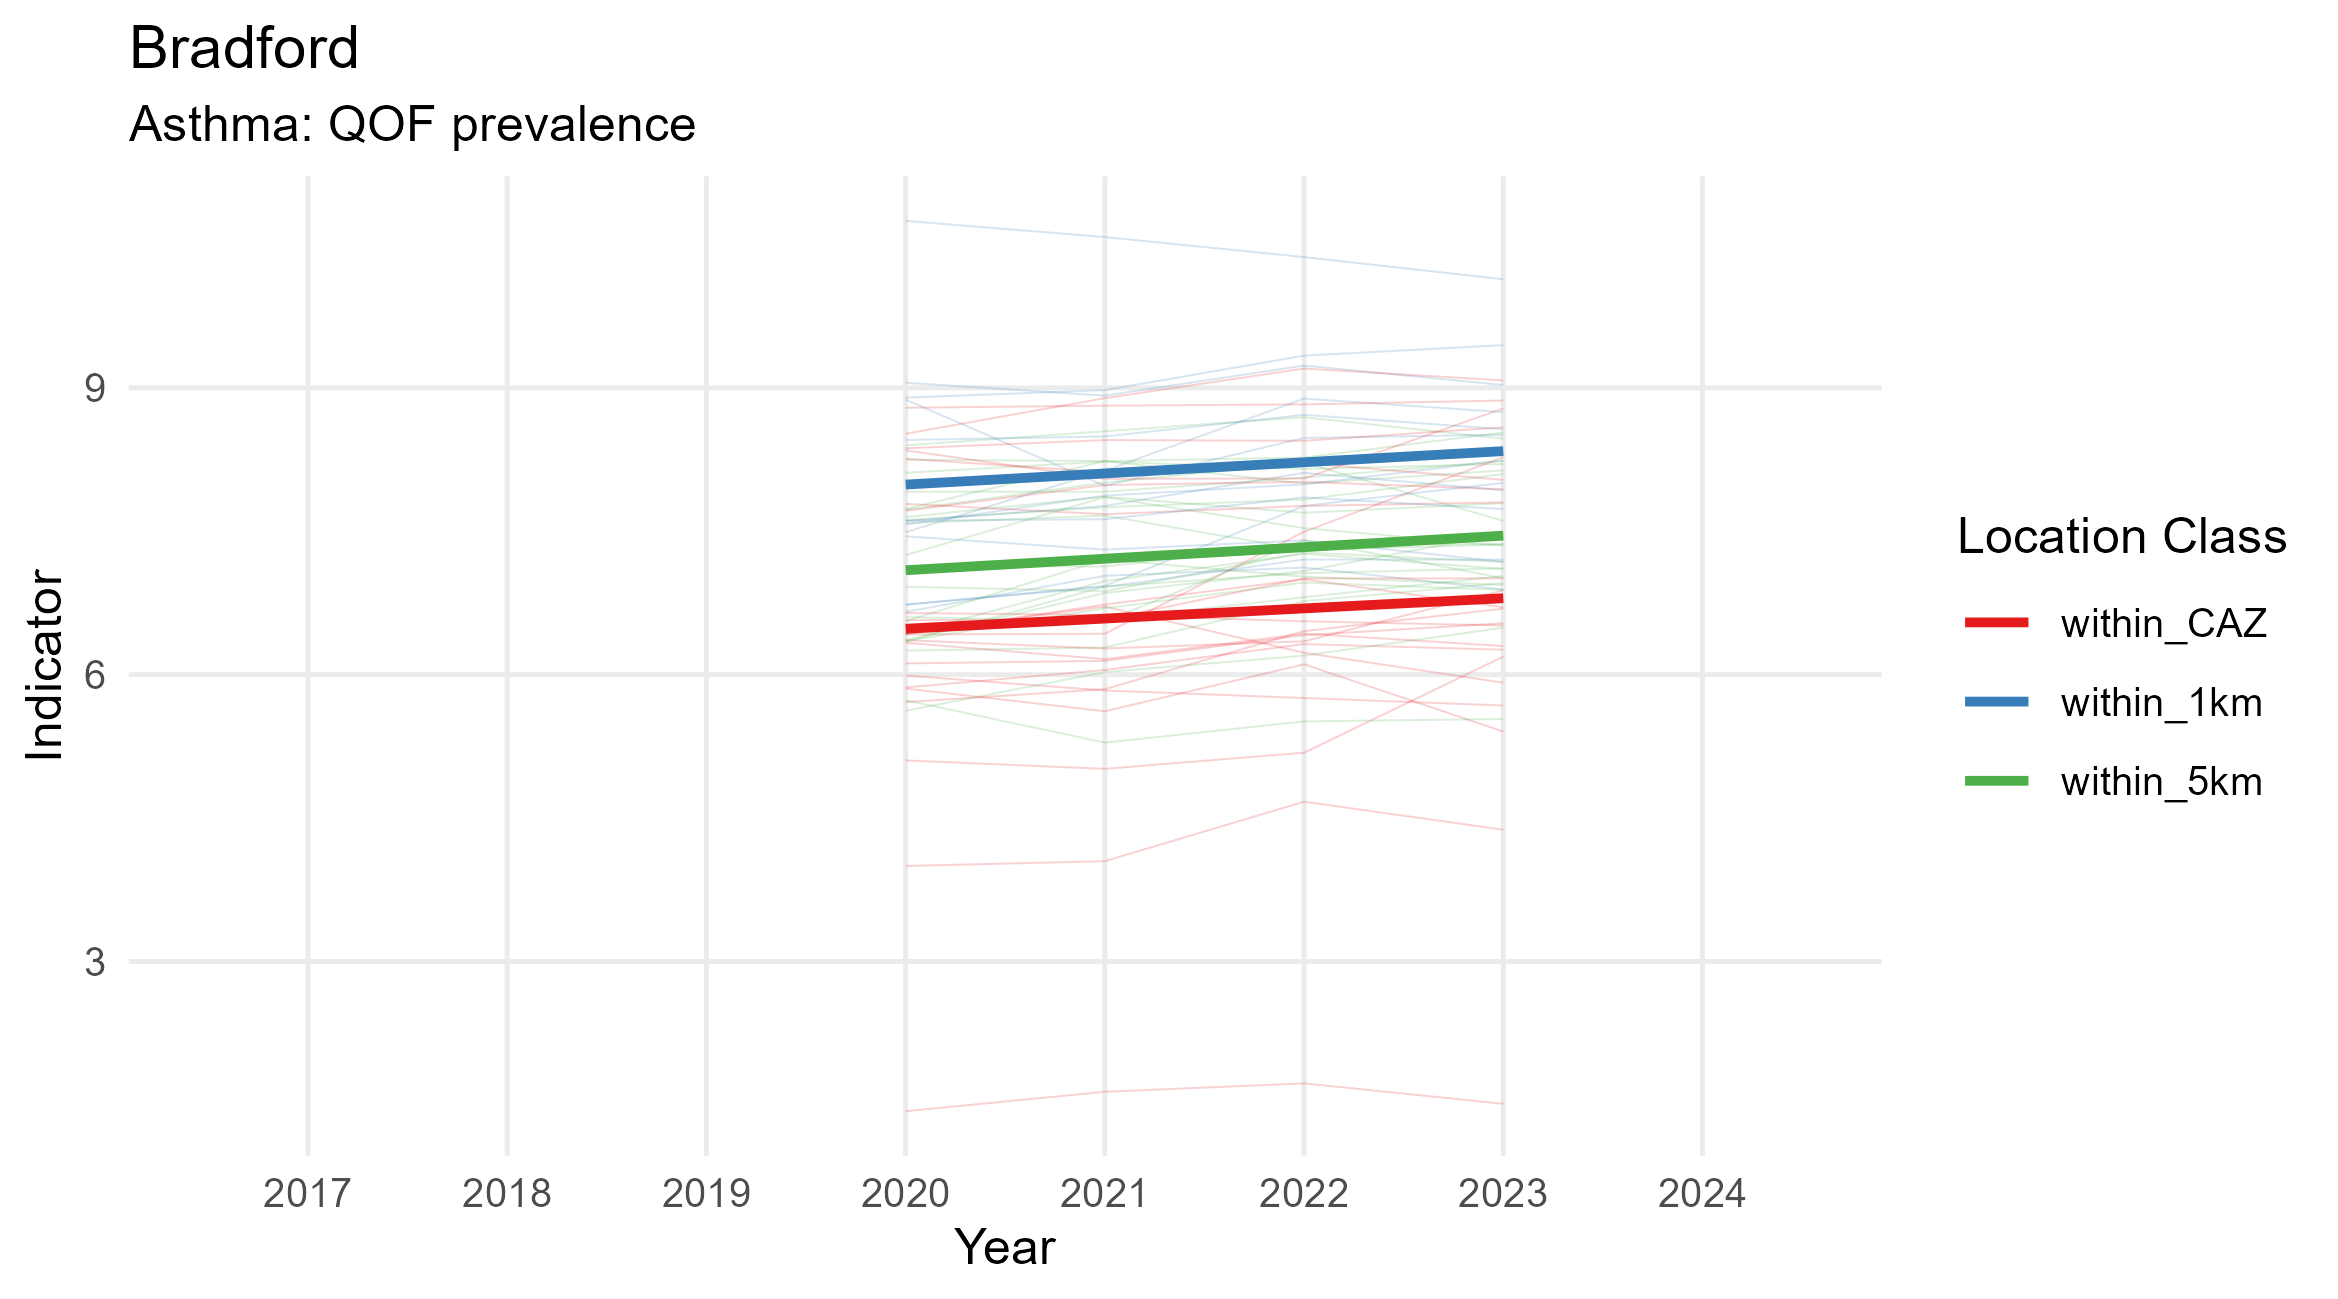
Trends by CAZ location
Overall trend for all practices in each area type
cazfiltered = transpose(cazdata).filter(function(record) {
return 2021 < record.year && caztype.includes(record.desc) ;
})

cazfiltered_full = transpose(cazdata).filter(function(record) {
return caztype.includes(record.desc) ;
})
Plot.plot({
  y: {
    grid: true,
    label: "items/patient",
    transform: (f) => (f*1)
  },
  x: {
  transform: (x) => d3.timeParse("%Y-%m-%d")(x),
  interval: "month"
  },
  color: {legend: true},
  marks: [
    Plot.ruleY([0]),
    Plot.lineY(cazfiltered_full,
    {x: "date",
    y: "indicator",
    stroke: "#aaa7ad",
    z: "location_class",
    strokeOpacity: 0.2}),
    Plot.lineY(cazfiltered,
    {x: "date",
    y: "indicator",
    stroke: "location_class",
    marker: "dot",
    strokeOpacity: 0.3}),
    Plot.linearRegressionY(cazfiltered,
    {x: "date",
    y: "indicator",
    stroke: "location_class"})
    ]
})
Trend by practices
Trend for specific practices, select the practice(s) of interest:
viewof names = Inputs.select(praclist, {multiple: 6, label: "Practices",value: ["PARK GRANGE MEDICAL CENTRE","THE CITY MEDICAL PRACTICE"]})
datafiltered = transpose(pracdata).filter(function(record) {
return 2021 < record.year && caztype.includes(record.desc) && names.includes(record.row_name) ;
})

datafiltered_fulltime = transpose(pracdata).filter(function(record) {
return caztype.includes(record.desc) && names.includes(record.row_name) ;
})

datafiltered_full = transpose(pracdata).filter(function(record) {
return caztype.includes(record.desc) ;
})
Plot.plot({
  y: {
    grid: true,
    label: "items/patient",
    transform: (f) => (f*1)
  },
  x: {
  transform: (x) => d3.timeParse("%Y-%m-%d")(x),
  interval: "month"
  },
  color: {legend: true},
  marks: [
    Plot.ruleY([0]),
    Plot.lineY(datafiltered_full,
    {x: "date",
    y: "indicator",
    stroke: "#aaa7ad",
    z: "row_name",
    strokeOpacity: 0.2}),
    Plot.lineY(datafiltered_fulltime,
    {x: "date",
    y: "indicator",
    stroke: "row_name",
    marker: "dot",
    strokeOpacity: 0.3}),
    Plot.linearRegressionY(datafiltered,
    {x: "date",
    y: "indicator",
    stroke: "row_name"})
    ]
})
Health Indicators
Annual health indicators are available from https://fingertips.phe.org.uk/ for some GP practices.