── Attaching core tidyverse packages ──────────────────────── tidyverse 2.0.0 ──
✔ dplyr     1.1.4     ✔ readr     2.1.5
✔ forcats   1.0.0     ✔ stringr   1.5.1
✔ ggplot2   3.5.1     ✔ tibble    3.2.1
✔ lubridate 1.9.4     ✔ tidyr     1.3.1
✔ purrr     1.0.4
── Conflicts ────────────────────────────────────────── tidyverse_conflicts() ──
✖ dplyr::filter()         masks stats::filter()
✖ readr::guess_encoding() masks rvest::guess_encoding()
✖ dplyr::lag()            masks stats::lag()
ℹ Use the conflicted package (<http://conflicted.r-lib.org/>) to force all conflicts to become errors
library(sf)
Linking to GEOS 3.13.0, GDAL 3.10.1, PROJ 9.5.1; sf_use_s2() is TRUE
library(tmap)
From the NHS we can extract total number of patients registered after each month. This code downloads all monthly reports programmatically and extracts the zip files
base_u <-"https://digital.nhs.uk/data-and-information/publications/statistical/patients-registered-at-a-gp-practice/"my_grid <-expand.grid(month =tolower(month.name),year =2020:2024 ) my_grid$u <-paste(my_grid$month,my_grid$year,sep ="-")# i <- my_grid$u[1]folder_path <-"gp_patients"dir.create(path = folder_path,showWarnings = F)cur_files <- tools::file_path_sans_ext(list.files(folder_path))my_grid <- my_grid[!(my_grid$u %in% cur_files),]for (i in my_grid$u){print(paste0(base_u,i)) w <-read_html(paste0(base_u,i)) links <- w |>html_nodes("a") |>html_attr("href") my_link <- links[grep(links,pattern ="gp-reg-pat-prac-all")]download.file(url = my_link,destfile =paste0(folder_path,"/",i,".",tools::file_ext(my_link)),mode ="wb")Sys.sleep(rnorm(1,mean =5))}# List all ZIP files in the folderzip_files <-list.files(path = folder_path, pattern ="\\.zip$", full.names =TRUE)# Extract each ZIP filelapply(zip_files, function(zip_file) {# Create a temporary directory for extraction temp_dir <-tempfile()dir.create(temp_dir)# Extract the ZIP file into the temporary directoryunzip(zip_file, exdir = temp_dir)# List extracted files extracted_files <-list.files(path = temp_dir, full.names =TRUE)# Move and rename each extracted file to the original folderlapply(extracted_files, function(file) { file_extension <- tools::file_ext(file) new_name <-file.path(folder_path, paste0(tools::file_path_sans_ext(basename(zip_file)), ".", file_extension))file.rename(file, new_name) })# Remove the temporary directoryunlink(temp_dir, recursive =TRUE)})
Warning: Removed 1 row containing non-finite outside the scale range
(`stat_bin()`).
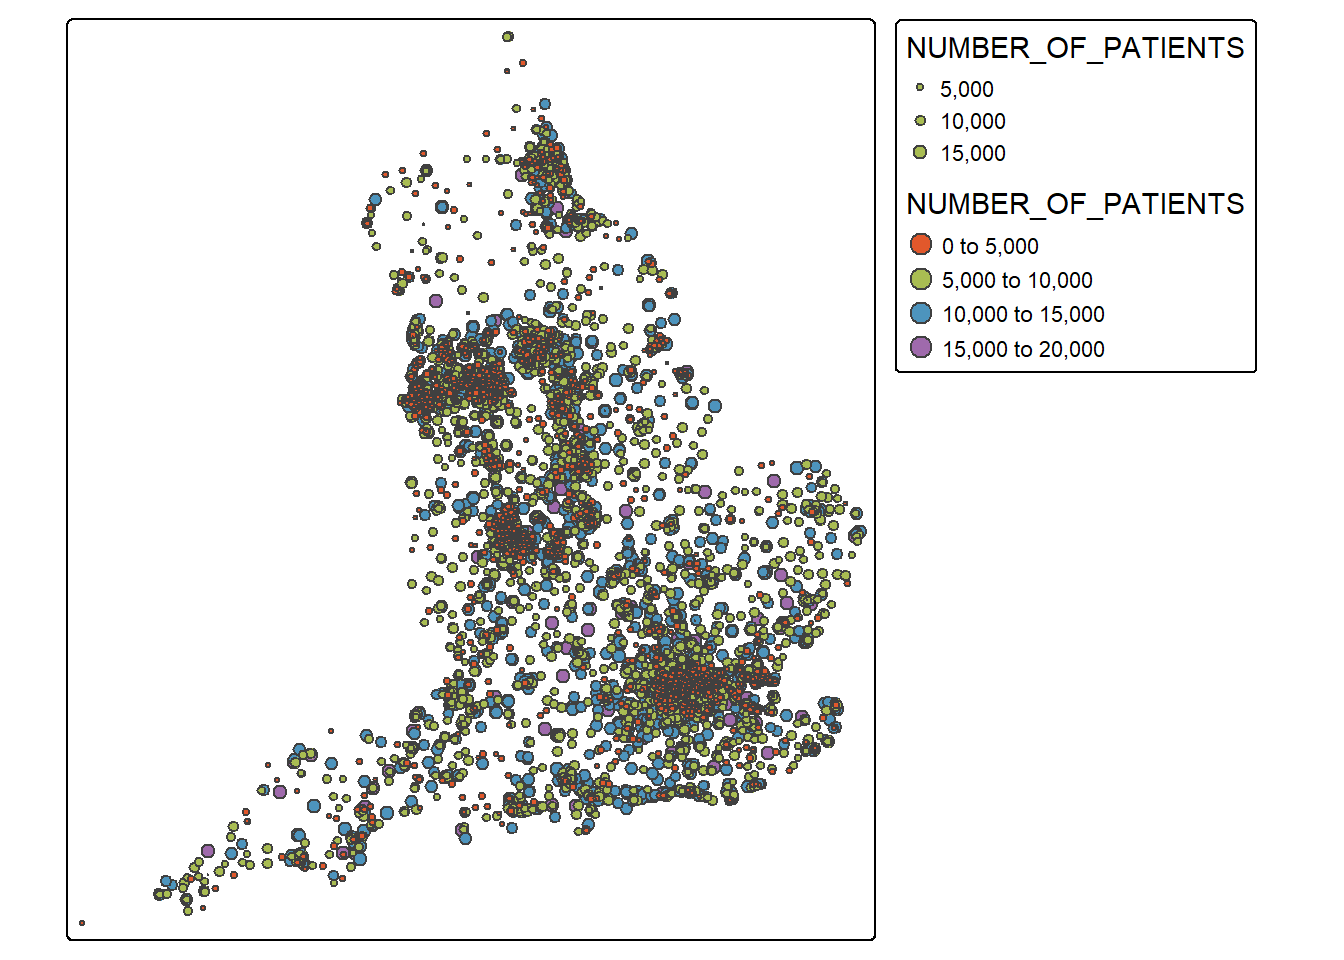
The spatial distribution
sf_practices <-st_read("practices_CAZ.gpkg")
Reading layer `practices_CAZ' from data source
  `C:\Users\ts18jpf\OneDrive - University of Leeds\03_PhD\00_Misc_projects\Eng-Presc-Data\practices_CAZ.gpkg'
  using driver `GPKG'
Simple feature collection with 11864 features and 10 fields (with 4 geometries empty)
Geometry type: POINT
Dimension:     XY
Bounding box:  xmin: 90774 ymin: 10282 xmax: 655043 ymax: 653236
Projected CRS: OSGB36 / British National Grid